The Numbers Behind the Pandemic
How can we quantify a pandemic? Or any disease outbreaks?
For years, researchers have studied what constitutes a disease outbreak and have assigned a numerical value to determine the likelihood of an infectious disease becoming an outbreak. This number is called the basic reproduction number, and in this post we will be giving you a crash course on what it is and what it means in terms of COVID-19.
The Basic Reproduction Number

The basic reproduction number is a measure scientists use to describe the contagiousness of an infectious agent such as virus, bacteria, fungi, and/or parasites. The basic reproduction number, or Ro (pronounced ‘R nought’), is typically reported as a single number and can range from 0 and move upwards depending on how contagious a disease is.
Check out the infographic to the left to see an example of how a virus with an Ro of 2 will spread.
How is it calculated?

Ro is calculated using the formula to the right. It is a direct proportion of how many new cases an existing case will generate during its period of communicability in a susceptible population. For example, mumps has a theoretical Ro of 10, meaning that if one person is infected with mumps, then they will infect 10 other people with mumps (assuming they are in a susceptible population).
The period of communicablity is defined as the time when an infected person is contagious, and a susceptible population to be a population that does not have immunity to the disease. This means that if the population is not vaccinated for the disease, and no one has had the disease before, it becomes very difficult to control the spread of the disease.
Other Contributing Factors
While we are showing you a simple equation to determine how contagious a disease is, there are other factors that can affect Ro and here we will outline 3 of them:
1. Period of Communicability - as defined earlier, this is the time in which an infected person can infect others. It can be while the patient is asymptomatic, pre-symptomatic, or symptomatic. Research suggests that patients infected with COVID-19 are more likely to be contagious around the time symptoms first begin to appear. Different diseases have different infectious periods, and a longer period of infectiousness will lead to a higher Ro.
2. Route of transmission - how the disease is spread, whether it be through physical contact, air droplets, blood, or other means. COVID-19 is seen to be spread through respiratory droplets, the particles released when an infected person coughs and sneezes. This can happen directly or indirectly if you touch a surface that has been contaminated with these infectious droplets.
3. Contact rate - how often and how many people an infected person comes into contact with. If an infected individual decides to go out, meet up with friends, or take public transport - this all leads to a higher contact rate and a higher chance of infecting others. This is why social distancing, self-isolation and quarantining is so important during these times.

Stopping just one interaction can have exponential effects.
How to Interpret the Numbers
For COVID-19, the values we really want to focus on are the numbers surrounding the value 1.
Healthline states the following in terms of Ro values:
When Ro is greater than 1, each existing infection will cause more than one new infection. This number indicates that the disease will spread, cause an outbreak, or continue to grow to an outbreak.
When Ro is equal to 1, each existing infection will cause one new infection. This means that the disease is considered to be 'stable'. The disease will stay alive but it is not likely to result in an outbreak.
When Ro is less than 1, each existing infection will cause less than one new infection. Having an R0 being less than 1 is an indicator that the disease is declining and that it should die out.
The Goal Number
The Ro of COVID-19 currently varies from country to country, and is highly dependent on each country’s response to the pandemic. The goal for each country is to get the Ro under 1 and as close to 0 as possible to slow and stop the spread of the disease. In countries that are enforcing the strictest of social distancing laws, we can see a decrease in the Ro value.
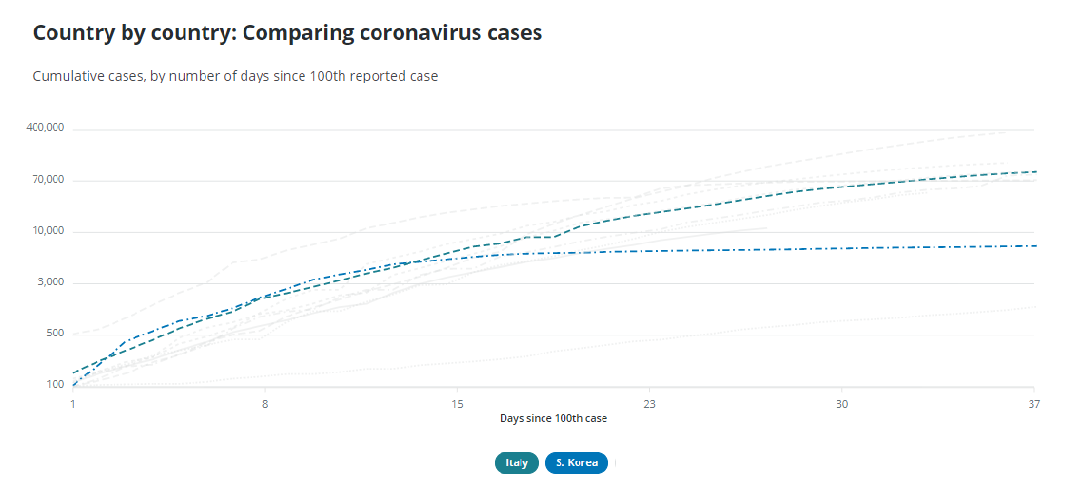
As of 7 April 2020, Italy’s daily COVID-19 toll fell to its lowest it’s seen in the past two weeks. In the country which had over 15,000 deaths due to COVID-19, we are seeing that the country’s series of strict lockdown has led its Ro value to drop from 3 to 1.
Italy is flattening its curve.
Similarly, South Korea has flattened its curve with daily new cases dropping from its peak of around 850 at the beginning of March, to less than 50 as of 6 April 2020. This mass drop is attributed to their efficiency in COVID-19 testing and extensive efforts to track and isolate people infected with COVID-19. The government even released a smartphone app to track and ensure infected individuals were staying home and isolating.
Suffice to say, controlling the reproduction number of COVID-19 is the repricing of both a countries government and its population. Each action we take, as healthy or infected individuals, can help to flatten the curve and bring our Ro number closer to 0.
Scientific Journal Sources:
https://www.ncbi.nlm.nih.gov/pmc/articles/PMC6302597/
https://www.sciencedirect.com/science/article/abs/pii/S0025556419305358
https://wwwnc.cdc.gov/eid/article/25/1/17-1901_article
https://www.cps.ca/en/documents/position/current-epidemiology-and-guidance-for-covid-19-march-2020
Media Sources:
https://www.theatlantic.com/science/archive/2020/01/how-fast-and-far-will-new-coronavirus-spread/605632/
https://theprint.in/world/this-is-how-italy-managed-to-bring-its-daily-coronavirus-toll-down-to-lowest-in-2-weeks/396481/
https://www.sciencemag.org/news/2020/03/coronavirus-cases-have-dropped-sharply-south-korea-whats-secret-its-success
Image Sources:
https://www.shutterstock.com/search/disease+transmission
http://theconversation.com/r0-how-scientists-quantify-the-intensity-of-an-outbreak-like-coronavirus-and-predict-the-pandemics-spread-130777
https://www.nytimes.com/2020/03/19/health/coronavirus-distancing-transmission.html
https://newsinteractives.cbc.ca/coronaviruscurve/